Revenue
| Summarized Revenues | 2018 | 2019 | 2020 | 2021 | 2022 | 2023 | 2024 |
|---|---|---|---|---|---|---|---|
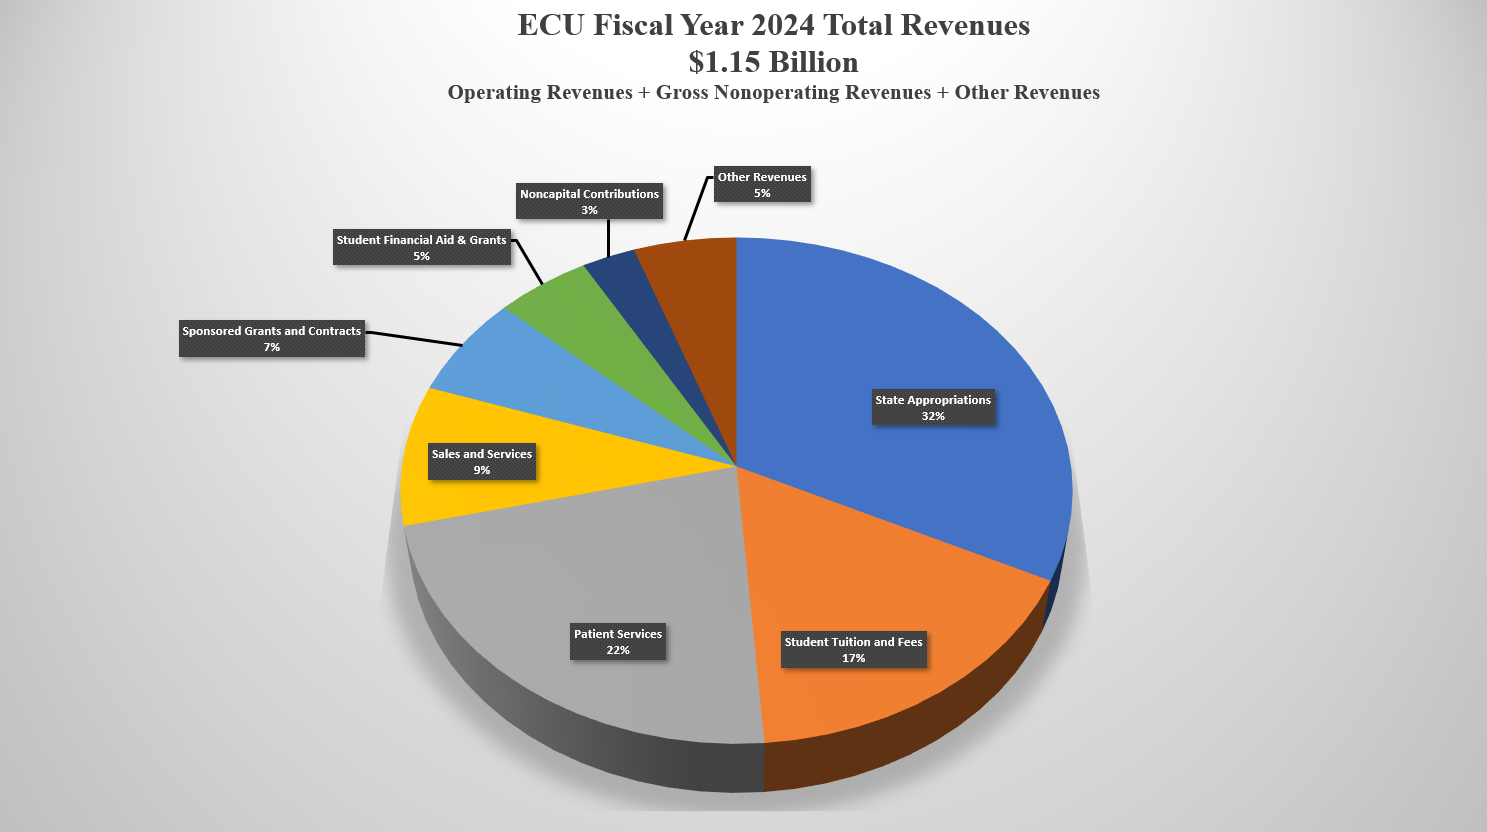
| State Appropriations | $304,945,175 | $309,395,459 | $312,237,868 | $296,470,173 | $329,264,475 | $355,729,327 | $368,692,677 |
| Student Tuition and Fees | $203,201,275 | $195,901,453 | $187,623,856 | $180,793,966 | $186,784,895 | $187,546,252 | $190,023,546 |
| Patient Services | $222,351,903 | $213,295,932 | $227,071,300 | $233,127,641 | $243,121,973 | $244,760,059 | $257,222,339 |
| Sales and Services | $95,885,674 | $90,597,428 | $81,251,135 | $46,984,278 | $85,935,067 | $97,602,901 | $102,727,334 |
| Sponsored Grants and Contracts | $42,575,914 | $47,835,104 | $52,900,467 | $58,857,573 | $65,676,437 | $69,802,646 | $74,693,289 |
| Student Financial Aid & Grants | $39,576,685 | $40,987,037 | $55,599,402 | $66,906,106 | $59,174,814 | $54,421,595 | $57,114,338 |
| Noncapital Gifts | $32,203,575 | $33,133,143 | $12,442,119 | $15,640,628 | $13,897,746 | $20,719,521 | $32,403,747 |
| Other Revenues | $13,424,044 | $9,384,846 | $25,243,061 | $87,927,644 | $50,698,573 | $38,997,367 | $62,161,417 |
| Federal Aid - COVID | $17,461,198 | $31,071,523 | $45,347,024 | $14,368,451 | |||
| Net Investment Income | $8,430,875 | $8,681,724 | $4,512,403 | $20,354,553 | $256,342 | $26,995 | |
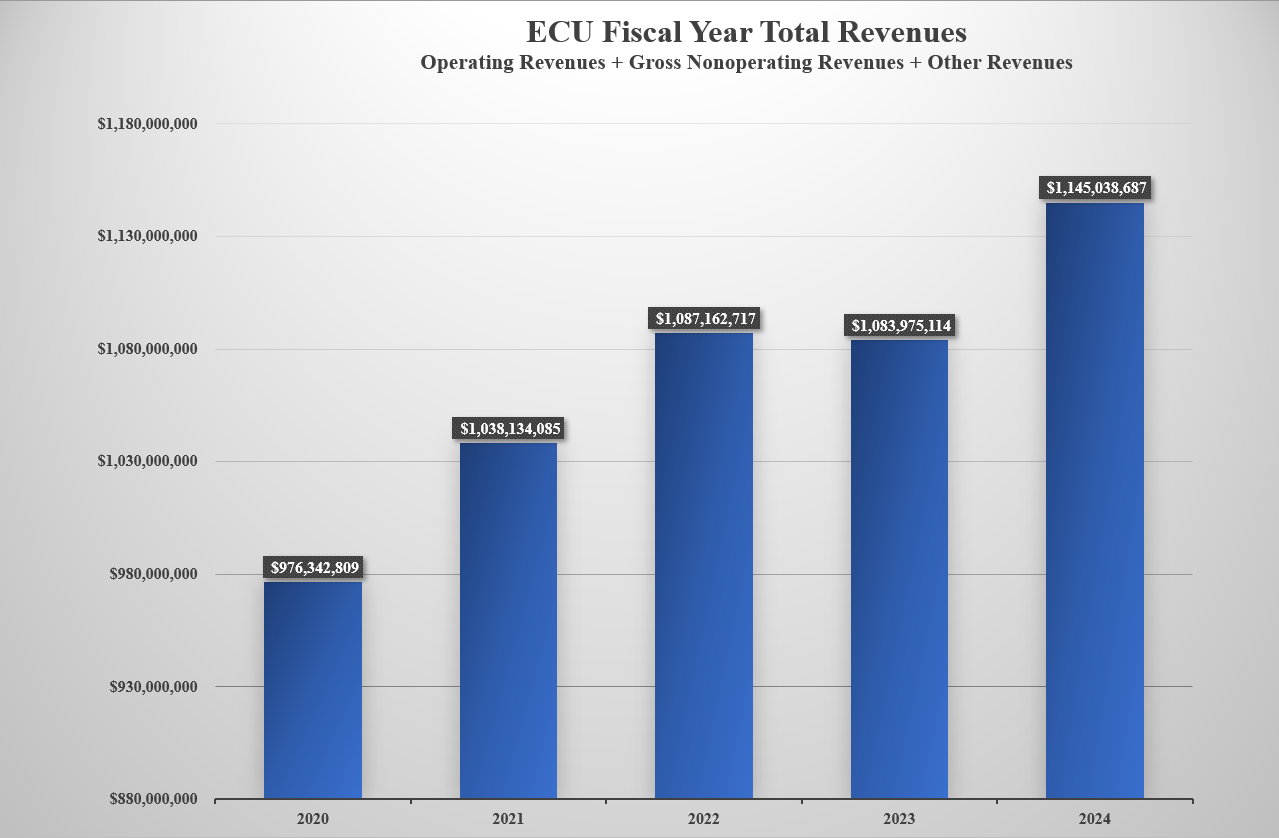
| Total Revenues | $962,595,120 | $949,212,126 | $976,342,809 | $1,038,134,085 | $1,080,157,346 | $1,083,975,114 | $1,145,038,687 |
| Detailed Revenues | 2018** | 2019 | 2020 | 2021 | 2022 | 2023 | 2024 |
|---|---|---|---|---|---|---|---|
| Student Tuition and Fees, Net | $203,201275 | $195,901,453 | $187,623,856 | $180,793,966 | $186,784,895 | $187,546,252 | $190,023,546 |
| Patient Services, Net | $222,351,903 | $213,295,932 | $227,071,300 | $233,127,641 | $243,121,973 | $244,760,059 | $257,222,339 |
| Federal Grants and Contracts | $18,138,969 | $22,131,090 | $25,198,599 | $36,766,334 | $44,205,241 | $46,145,994 | $47,624,071 |
| State and Local Grants and Contracts | $11,769,253 | $11,979,451 | $14,149,530 | $8,569,437 | $7,450,158 | $8,341,354 | $9,924,258 |
| Nongovernmental Grants and Contracts | $12,667,692 | $13,724,563 | $13,552,338 | $13,521,802 | $14,021,038 | $15,315,298 | $17,144,960 |
| Sales and Services, Net | $95,885,674 | $90,597,428 | $81,251,135 | $46,984,278 | $85,935,067 | $97,602,901 | $102,727,334 |
| Interest Earnings on Loans | $44,322 | $46,658 | $46,210 | $289,320 | $256,342 | $26,995 | $185,049 |
| Other Operating Revenues | $1,384,430 | $1,763,927 | $1,820,276 | $1,177,143 | $1,971,159 | $3,017,046 | $2,987,028 |
| State Appropriations | $304,945,175 | $309,395,459 | $312,237,868 | $296,470,173 | $329,264,475 | $355,729,327 | $368,692,677 |
| State Aid Corona Virus Relief | $2,160 | $23,731,237 | $8,347,432 | ||||
| Federal Aid Covid 19 | $17,461,198 | $31,071,523 | $45,347,024 | $14,368,451 | $1,809,673 | ||
| Noncapital Grants - Student Financial Aid | $39,576,685 | $40,987,037 | $39,141,282 | $55,374,724 | $54,791,665 | $54,421,595 | $57,114,338 |
| Noncapital Contributions | $32,203,575 | $33,133,143 | $28,900,239 | $27,172,010 | $18,280,895 | $20,719,521 | $32,403,747 |
| Investment Income (Net of Investment Expense) | $8,386,553 | $8,635,066 | $4,466,193 | $20,065,233 | $(7,005,371) | $15,414,459 | $27,146,921 |
| Federal Interest Subsidy on Debt | $405,319 | $388,694 | $369,264 | $103,486 | |||
| Interest Earned On Leases | $22,066 | $40,453 | |||||
| Other Non Operating Revenue | $942,611 | $495,087 | |||||
| Capital Appropriations | $4,044,303 | $2,767,091 | $56,872,719 | $22,672,699 | |||
| Capital Grants | $3,777,862 | $2,665,533 | $17,654,639 | $1,898,382 | $12,431,295 | $14,973,215 | $27,163,601 |
| Capital Gifts | $542,865 | $1,302,198 | $3,431,086 | $2,436,148 | $1,151,995 | $3,255,159 | $121,115 |
| Additions to Endowments | $3,269,265 | $497,403 | $1,965,636 | $1,708,529 | $3,159,316 | $2,297,035 | $2,252,943 |
| Total Revenues | $962,595,120 | $949,212,126 | $976,342,809 | $1,038,134,085 | $1,073,151,975 | $1,083,975,114 | $1,145,038,687 |
* Restated to record the University’s net other post-employment benefits liability and related deferred outflows/inflows of resources per GASB 75 requirements.
** Restated to record the University’s Workers’ Compensation Liability.